Sample analysis is quick and easy at Akinalytics with rapid turnaround and competitive pricing. View our Sample Analysis flat-rate pricing and request a quote for testing your sample or Contact us for more information.
Stay in the loop and in constant contact with our team of chemists and technicians. Receive the full report including original analysis results in native file formats, as well as in exported formats. Exported formats depend on the analysis, but may include Adobe Acrobat (.pdf), MS Excel (.xls), ASCII (.txt), JCAMP (.dx), or comma-separated values (.csv).
Analysis and testing are held confidential and your results will be for you alone. The following categories describe the types of testing available.
HNMR enables determination of chemical structure of any compound including hydrogen by analyzing the location of the hydrogen peak relative to deshielding. Low-field NMR spectral collection available via NMReady 60e (Nanalysis) for HNMR. Data exported in .dx format.
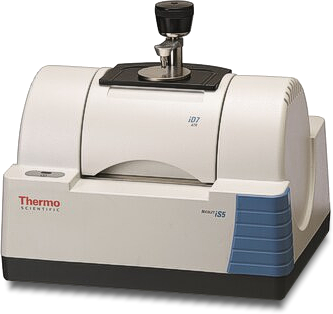
FTIR (Thermo Scientific-IS5 ID7-Smart Orbit Diamond ATR)
FTIR analysis of organic samples elucidates the chemical bonds present in the molecule based on their absorbance spectrum in the infrared region. The location of the peaks indicates the type of moieties present within the sample based on the specific locations for bending or flexing. The ATR accessory enables robust and easy sampling of various sample types.
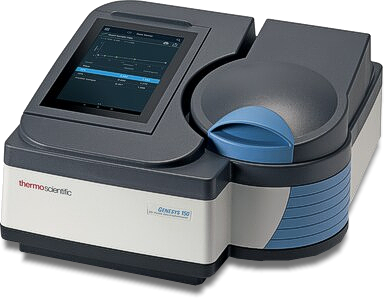
Certain compounds possess chromophore moieties which absorb ultra-violet/visible light at specific wavelengths. Thermo Genesys 150 UV-Vis spectrophotometer used to determine absorbance of Ultra-violet or visible light of a sample in the form of a solution. This can either be done for a specific wavelength or for a scan of absorbance across the entire spectrum from 190 – 900 nm.
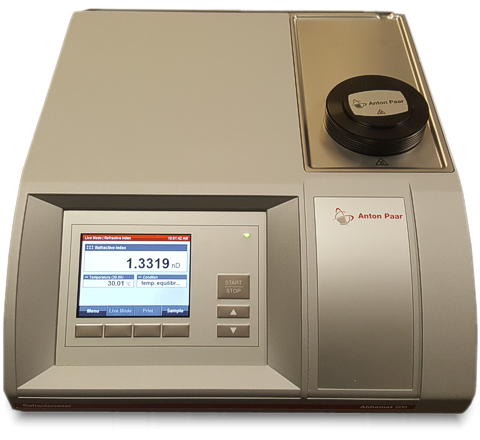
The refractive index of a material is a reference to its effect on the speed of light which causes light to bend in the material as it passes through at an angle. The Abbemat 200 measures refractive index from 1.30 to 1.72 at 589 nm with an accuracy of ±0.0001 at a controlled temperature ranging from 10-60°C.
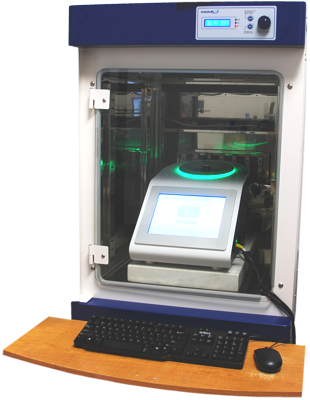
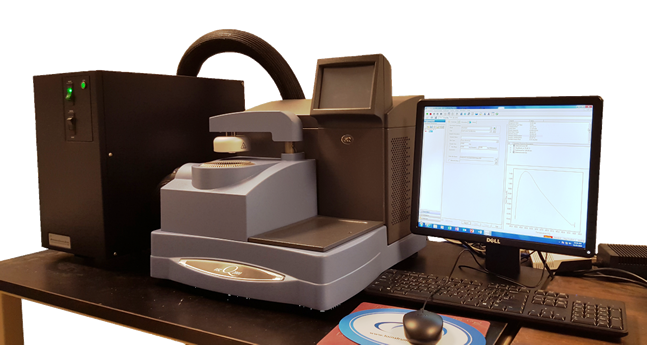
Differential scanning calorimetry (DSC) is the process by which a sample is heated through a pre-programmed rate and the change in heat-transfer at each temperature is measured. In addition to melting and other transitions, most polymers display a glass-rubber transition (Tg) at which point the polymer chains become flexible. Understanding this temperature is critical to predicting the polymer behavior. Modulated DSC analysis available from PolySciTech using a TA instruments Q2000 instrument operating under argon purge and controlled using a Discovery Refrigerated Cooling System - RCS90. This allows for testing samples in the range between -90 C to 550 C. Modulated DSC allows for collecting not just heat flow of the sample but also the reverse heat flow which is related to analysis of complex mixtures and multiple transitions.
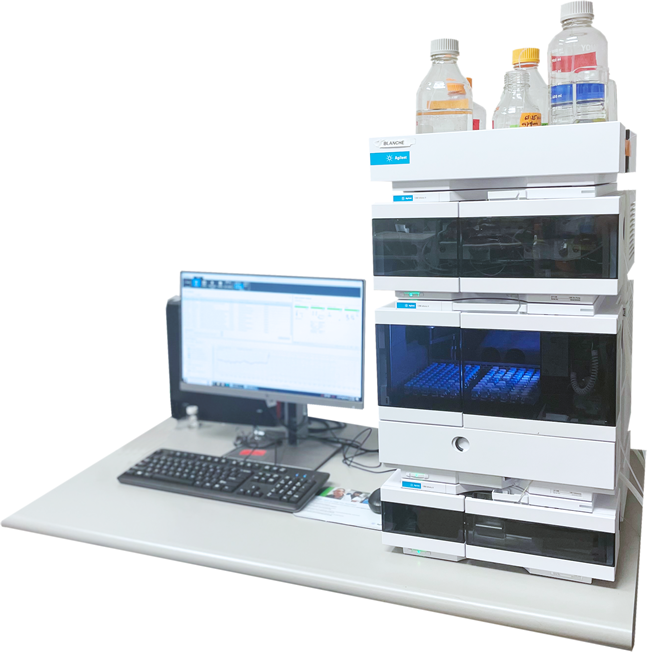
HPLC analysis is a process by which a liquid sample is separated by passing it across a stationary phase (column) using a mobile phase (eluent). This is available via several systems:
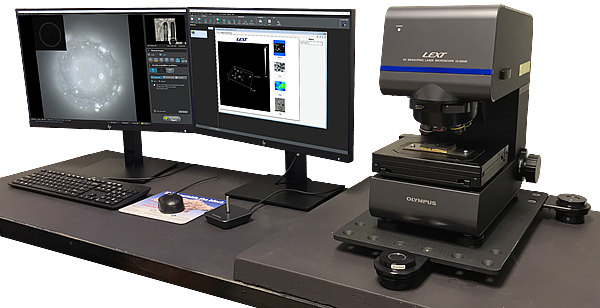
LEXT OLS5000 precisely measures shape and surface roughness at the submicron level. The 405 nm violet laser and dedicated high-NA objectives make it possible to capture fine patterns and defects that conventional optical microscopes, white-light interferometers, or red laser-based microscopes are unable to detect. Can provide NIST traceable calibration for precise measurements of dimensions as well as surface and area roughness parameters for your sample with no special preparation (sputter coating, vacuum purging, etc.) requirements.
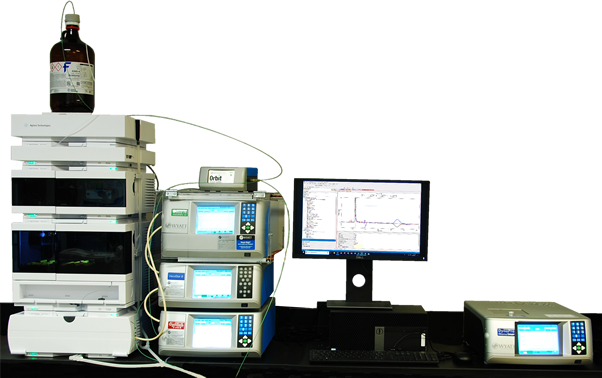
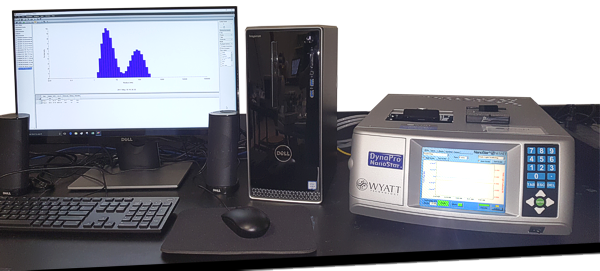
Gel-permeation chromatography is the process by which a polymer is separated according to its dwell-time in a microporous stationary phase (GPC column). The dwell-time is inversely proportional to the hydrodynamic size of the polymer, allowing the separation of materials based on molecular weight After separation, a variety of detection methods are available ranging from the simplest (refractive index) to detection to determine viscosity, molecular weight (multi-angle light scattering), and molecular size (in-line dynamic light scattering). GPC-4D system at Akina consistes of an Agilent 1260 Infinity II HPLC connected to Dawn Heleos II (MALLS) coupled to Dynapro Nanostar DLS via optical cable, Optilab T-rEX (RI detector) and Viscostar III viscometer operated by Astra 7 software. GPC analysis performed with separation by a linear gradient column (Tosoh Bioscience LLC, TSKgel GMHHR-L, 7.8 mm x 30 cm) at 0.6 ml/min flow of Acetone. Detection performed to determine viscosity, size, concentration, and molecular weight of each fraction simultaneously providing an incredibly comprehensive depiction of the polymer’s characteristics as shown by the values in the table below. Mark-Houwink Linear Estimate calculator
| Value | Description |
|---|---|
| MHS Intercept (K) | Mark-Houwink constant “K” |
| MHS slope(a) | Mark-Houwink constant alpha |
| Mn (kDa) | Number average Molecular weight |
| Mp (kDa) | Peak molecular weight |
| Mv (kDa) | Viscosity average molecular weight |
| Mw (kDa) | Weight average molecular weight |
| Mz (kDa) | Z-average molecular weight |
| Polydispersity (Mw/Mn) | Distribution of molecular mass |
| rn (nm) | Number-average mean square radius |
| rw (nm) | Weight-average mean square radius |
| rz (nm) | Z average radius |
| r(avg) (nm) | Average mean square radius |
| rh(v)n (nm) | Number-average hydrodynamic radius |
| rh(v)w (nm) | Weight-avg mean hydrodynamic radius |
| rh(v)z (nm) | Z-average hydrodynamic radius |
| rh(v)(avg) | Average hydrodynamic radius |
| [η]n (mL/g) | Number-average intrinsic viscosity |
| [η]w (mL/g) | Weight-average intrinsic viscosity |
| [η]z (mL/g) | Z-average intrinsic viscosity |
| dn/dc | Refractive index increment |
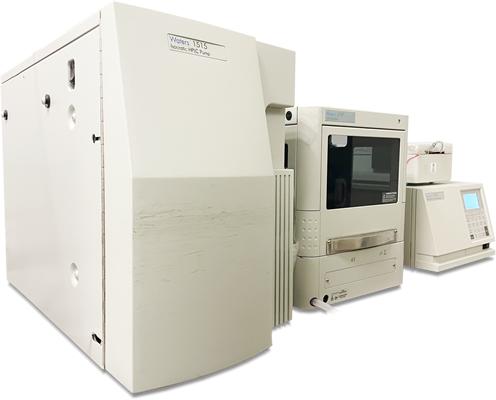
Conventional GPC, performed using Waters 1515 Breeze-II system with refractive index detection, is also available. For this system the sample is separated across 3-4 columns in sequence allowing for a higher degree of separation than typically obtained by GPC-4D. This system is used to determine molecular weight in the range of 400,000- 500 Da for a test sample as compared to polystyrene standards. This can be used for determination of number average molecular weight, weight average molecular weight, polydispersity index, and other parameters as desired.
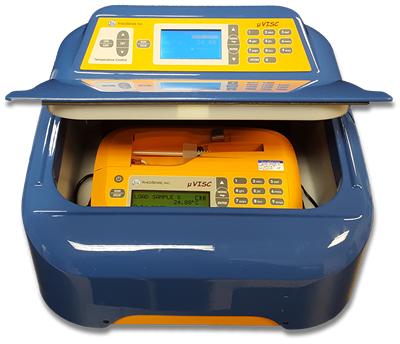
Viscosity is a measure of a fluid’s resistance to flow. Test viscosity of solutions in range of 0-100 cP under controlled temperature conditions. Ideal for dilute polymer viscosity testing or other low-viscosity samples in customer specified solvent.
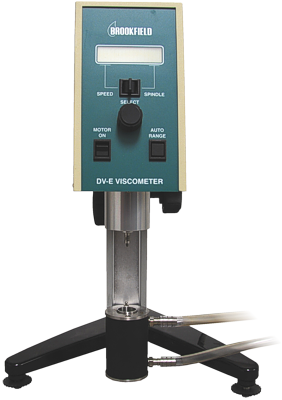
For larger, or more viscous samples, a model LV-DVE rotational viscometer is available. This may be equipped with a wide range of spindles for a variety of viscosity ranges. Temperature controlled small-sample adapter (13R) allows for accurate testing of material volumes < 20 ml.
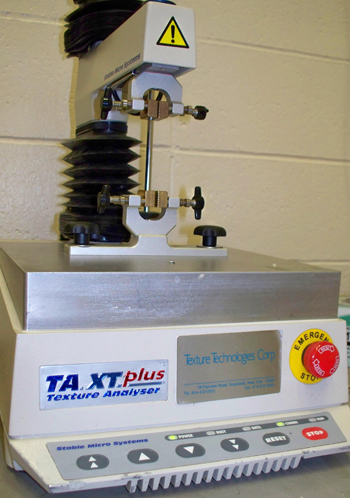
Mechanical analysis is the process by which a material is tested to determine its interaction with force. PolySciTech® offers texture analysis via a Texture Technologies Corporation TA.XTplus. The current configuration utilizes either a 5 kg load cell for extreme sensitivity with soft and elastic materials or a 30 kg load cell for stronger materials. The testing arm can be configured for compressive testing (1/4 inch steel ball, 1/2 inch dacron probe) tensile testing (tensile grips), or custom tests (3 point-break, needle-scratch test, friction, adhesion, syringe injectability).
Typical mechanical tests include elastic modulus from 0-2% strain, stress relaxation (a.k.a. creep) as percent decline in force over 60 seconds of being held at a constant strain, elongation to break, yield stress. Akina can custom design tests to your specifications as well as perform textural tests such as crispiness and firmness. Below are elastic modulus and stress relaxation of some common food ingredients.
| Item | Elasticity (kPa/%) | Stress Relaxation (%) |
|---|---|---|
| Marshmallow - (Great Value) | 0.6 ± 0.1 | 38.3 ± 1.8 |
| Gummi Worm - (Great Value) | 0.7 ± 0.2 | 46.2 ± 2.8 |
| Gum - (Ice Breakers "Ice Cubes") | 29.9 ± 7.7+ | 10.0 ± 1.5 |
| Crouton - (Rothbury Farms) | 36.6 ± 10.4 | 63.4 ± 14.1 |
| Sugar Cube - (Domino) | 112.0 ± 12.1 | NA* |
Mechanical analysis can be performed using texture exponent software allowing for mechanical as well as textural properties to be quantified.
Contact us for a quote.
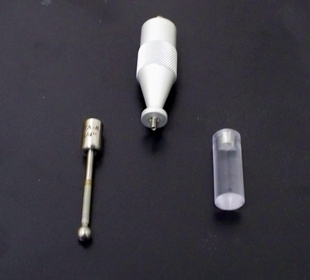
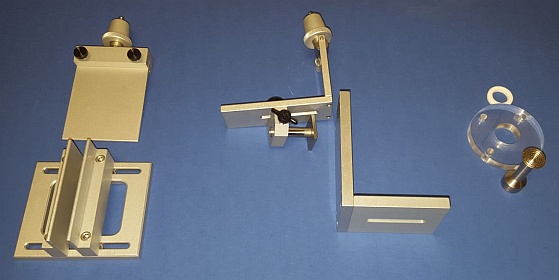
Dynamic light scattering determines the hydrodynamic radius of a sample by measuring the rate of its molecular motion. The Dynapro instrument, operated in batch mode, collects both static and dynamic light scattering signals for robust data. Commonly used for the analysis of proteins, inhibitors, micelles, quantum dots, liposomes, metallic nanoparticles and more. Available to assay in either water or a wide variety of organic solvents.
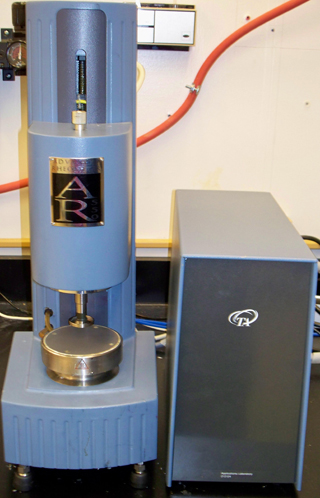
Rheometric testing is used to determine a fluid’s interaction with force in a dynamic manner. This assay can be performed at Akina, Inc. utilizing an AR2000 (TA Instruments) Rheometer in the temperature range of 0°C to 150°C.
This peltier controlled rheometer has both cone-plate and plate-plate configurations available ranging from 8 mm to 60 mm in diameter. Rheometer can do both basic viscosity as well as oscillation measurements with continuous or stepped sweeps of temperature, frequency, stress, as well as other variables. G',G", Delta and other rheometric variables are collected in oscillation mode. Rheological as well as molecular information about the material can be gleaned from this data.
Rheometric data can be analyzed on Rheology Advantage Data Analysis software.
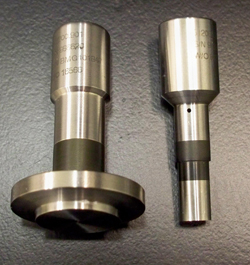
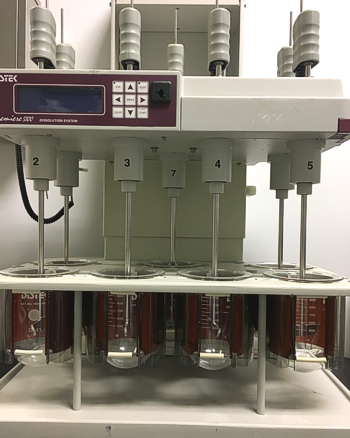
USP 1 and USP 2 dissolution testing is available with a Distek Premiere 5100 dissolution system. Seven jacketed vessels are available for dissolution testing with temperature control at 37 °C and 45 °C. Vessel volume is 500 mL to 1000 mL. Dissolution sample analysis available via HPLC.
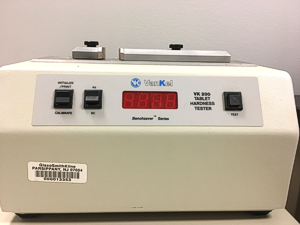
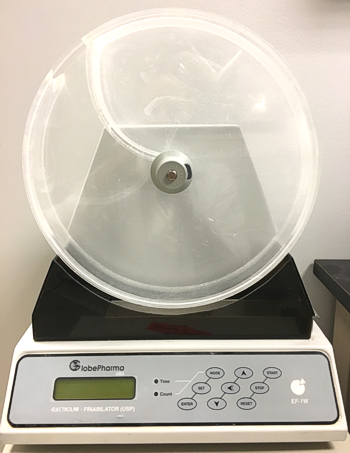
Tablet hardness and friability testing with a VanKel tablet hardness tester and GlobePharma friabilator, following USP guidelines.
Contact us for more information.